
World Statistics Day
To celebrate World Statistics Day, we’re sharing the infographics that have most influenced our work empowering women entrepreneurs and promoting financial inclusion here in the United States. Whether it is mapping New York City's unbanked population or tracking the revenue share of women-owned-businesses, data is central to the success of our program and will help chart the course ahead as we work to provide women entrepreneurs with the tools they need to succeed.
This New York Times interactive infographic tracks economic mobility by where an individual grows up.
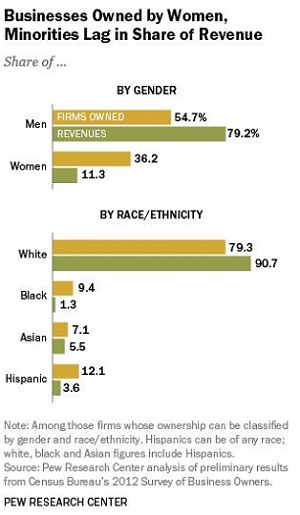
This Pew Research Center chart depicts how far behind women-owned businesses lag in revenue share in the United States.
Women Entrepreneurs of New York City (WE NYC), an initiative of the NYC Department of Small Business Services, compiled this report on the status of women entrepreneurs in New York City. The following infographic maps out the percentage of women-owned businesses in each New York City borough.
